
Footprint
Bid and ask at every price in each bar, delta and volume per row, imbalances outlined.
Eagle Charts is a desktop trading platform built around order flow. Footprint charts, volume profiles, delta and big trades show who is really buying and selling, and you trade straight from the chart.
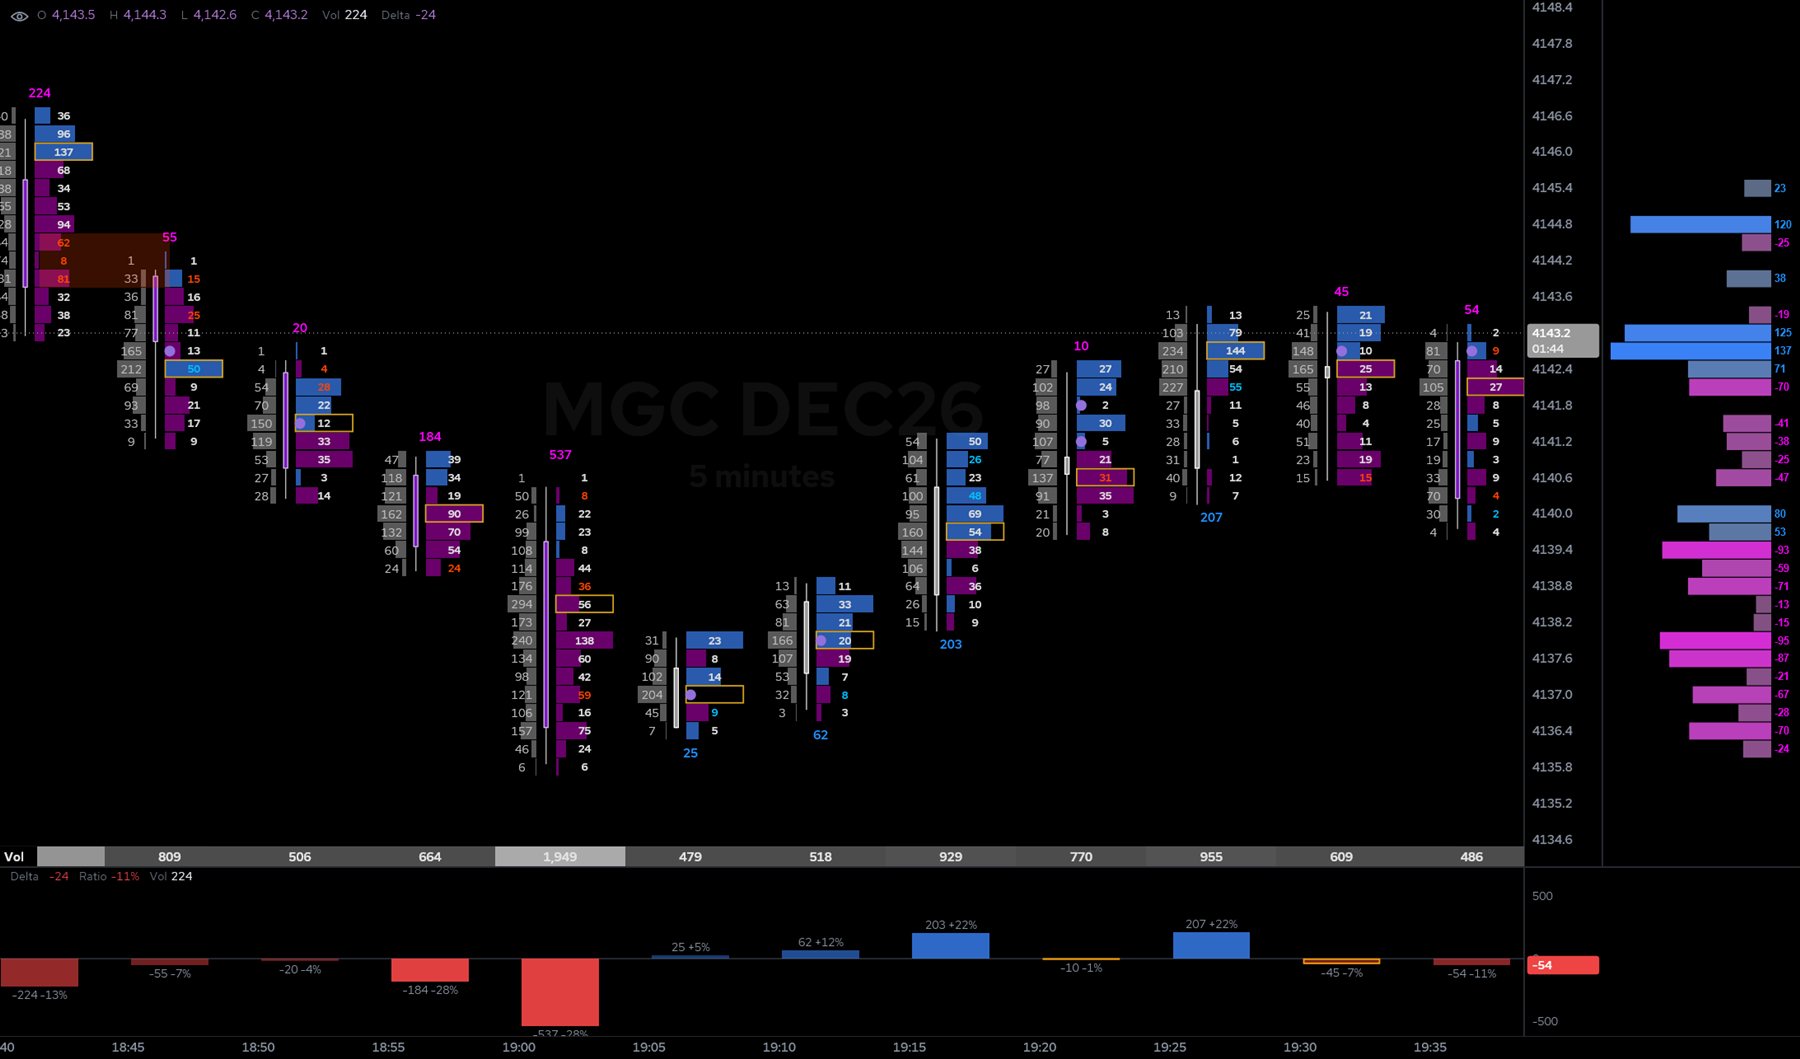
Footprint
See the volume sold at the bid and bought at the ask at every price inside each bar. Imbalances stand out, the delta profile sits beside the price axis, and delta bars below show who won each bar and how decisively.
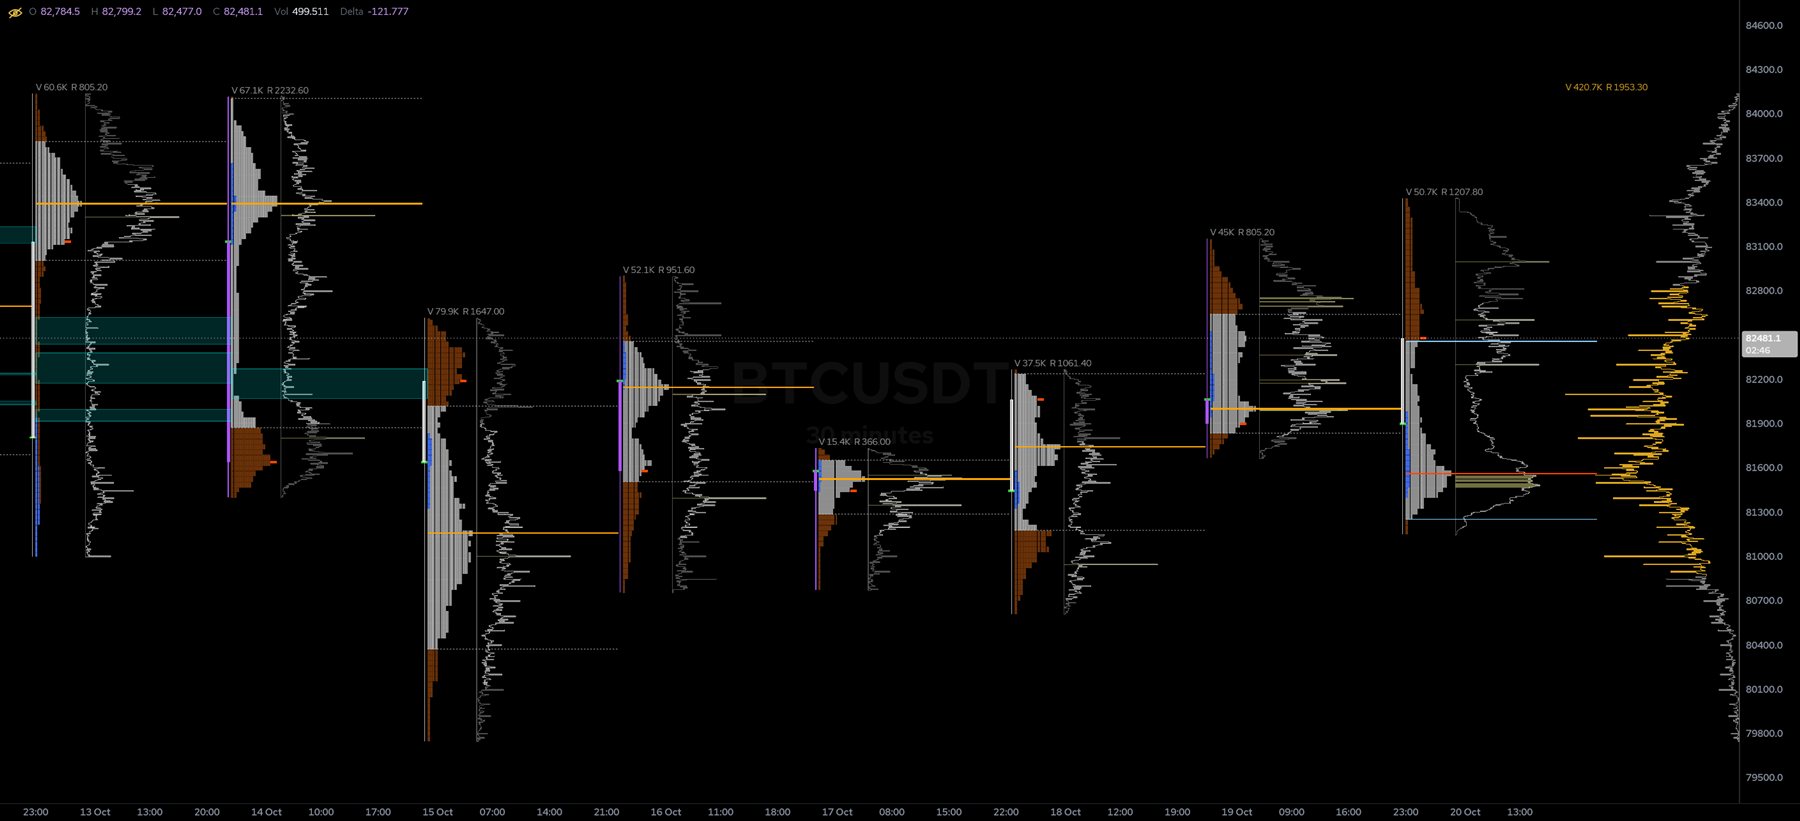
Volume profiles
Session profiles with value area and point of control, TPO beside them, and a composite of the whole range on the right. See where volume built up, where it was thin, and where price is likely to be accepted or rejected.
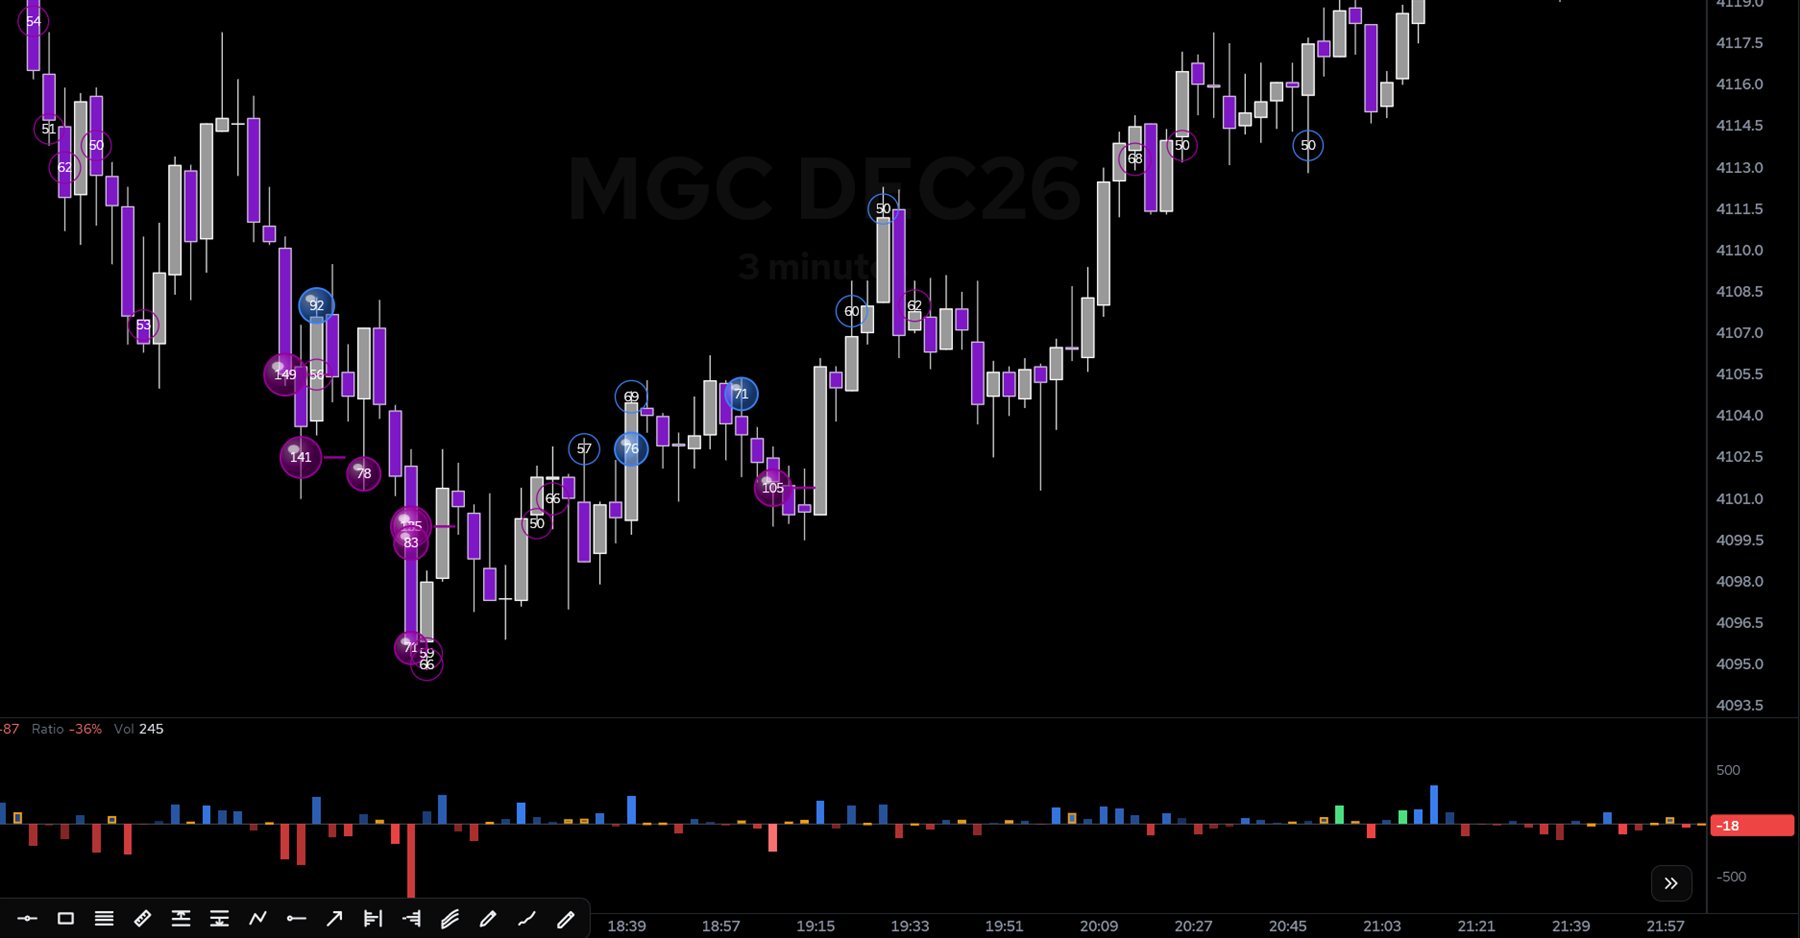
Big trades and delta
Large prints are marked right where they happened, sized by how big they were, buyers in blue and sellers in purple. Delta bars underneath show whether the aggression won the bar or got absorbed.
DOM
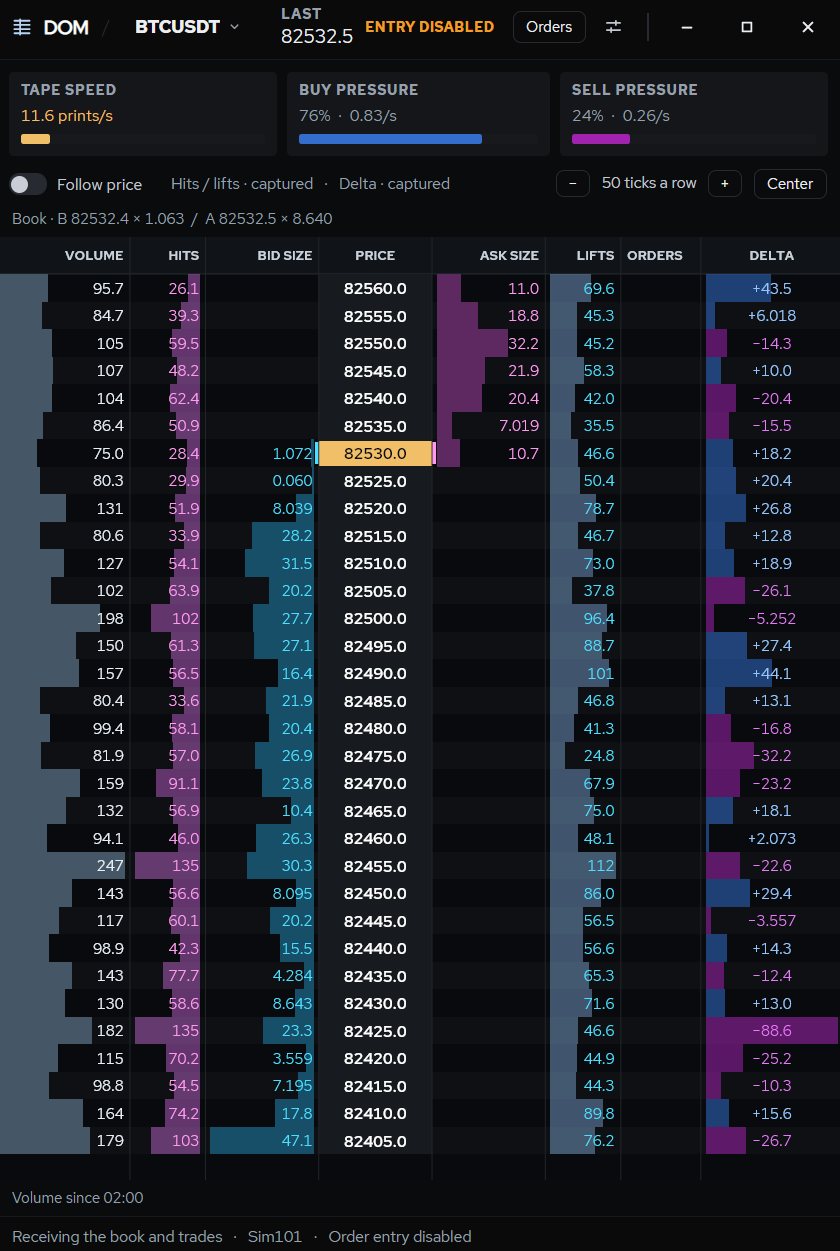
Bid and ask size at every price, the volume traded there, hits and lifts as they happen, and delta per price. Tape speed and buy and sell pressure sit on top, so you feel the pace before you click.
Trade from the chart
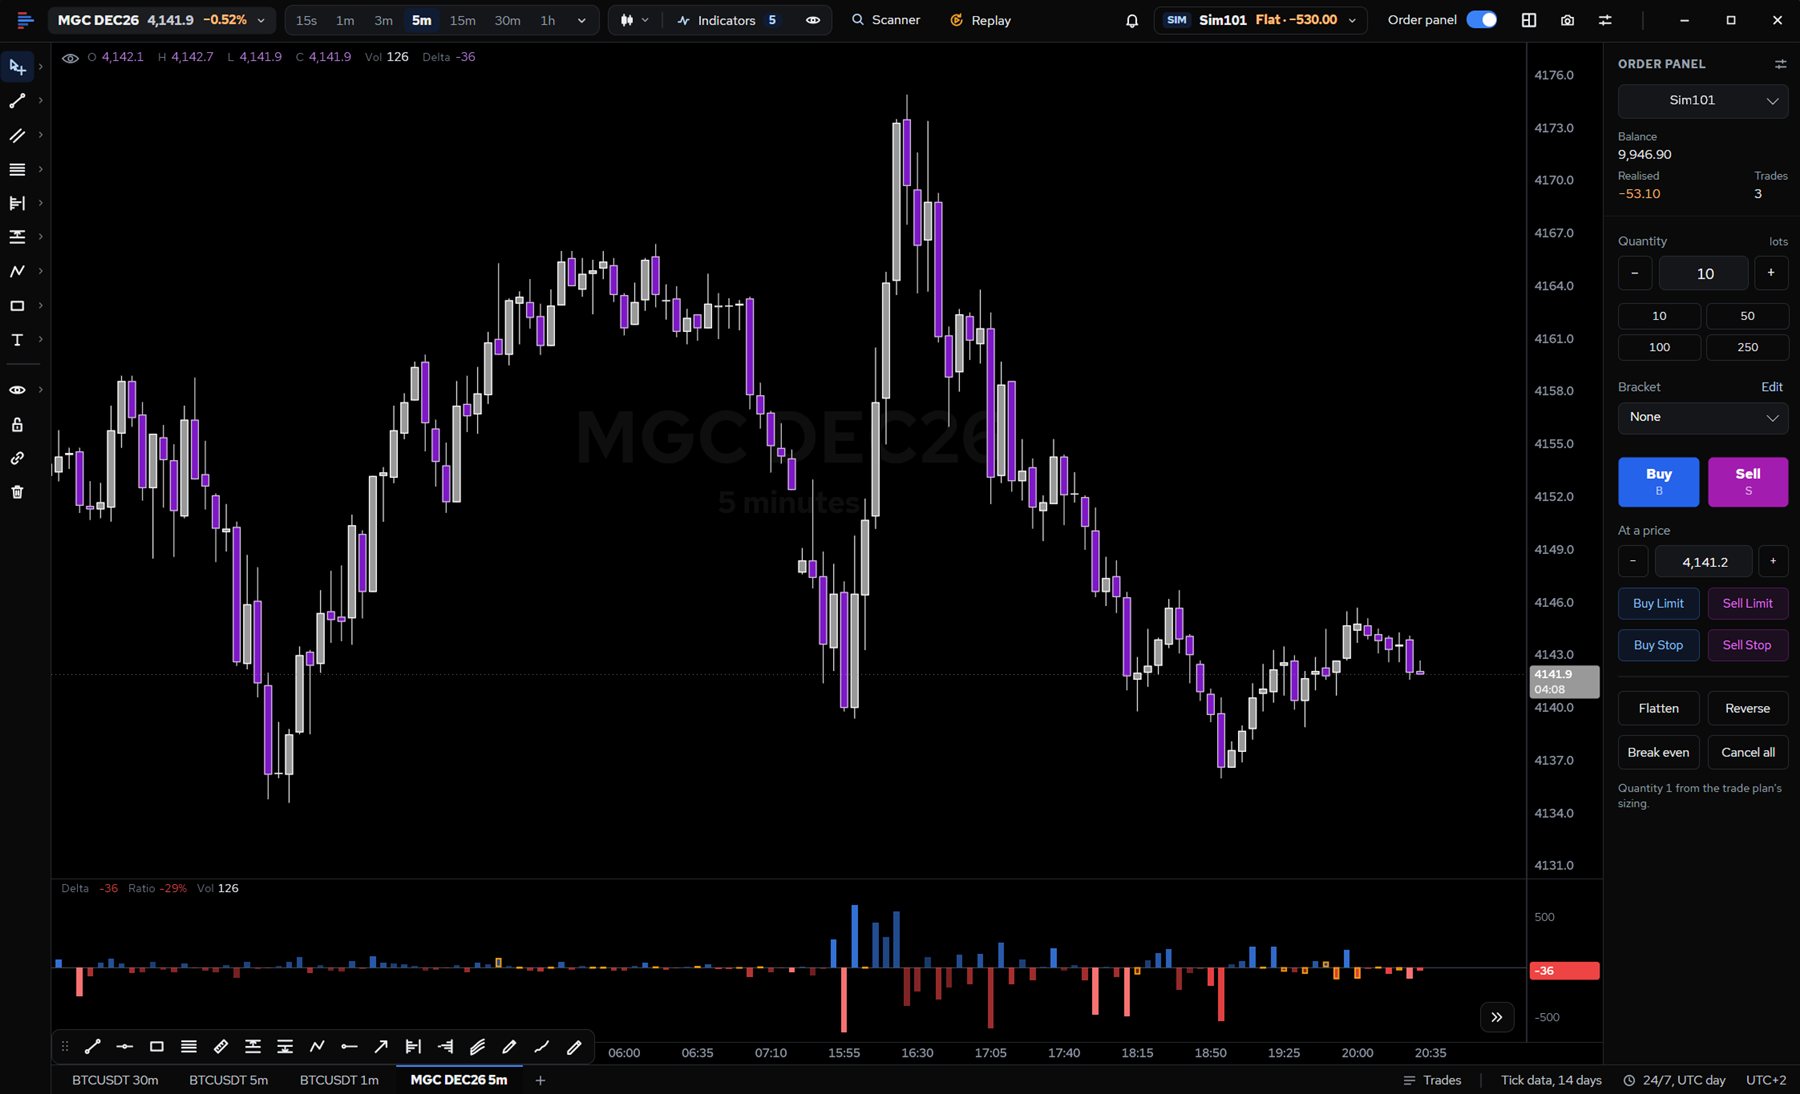
The order panel sits beside the chart with brackets, break even, flatten and reverse. Draw a trade plan and it works out the size from the money you want to risk, and shows how the trade played out.
Everything on the chart
Bid and ask at every price in each bar, delta and volume per row, imbalances outlined.
The ladder with volume, hits, lifts and delta at every price, and tape speed on top.
Session, composite and range profiles with value area, POC and naked levels.
Resting orders across the book over time, with every trade drawn on top.
Each bar's delta up or down, shaded by the delta ratio, divergence outlined.
CVD as a line or candles, in its own pane or over price.
Large prints marked where they happened, sized by how big they were.
Delta at each price for the session, beside the price axis or in its own panel.
Session and anchored VWAP with up to three bands and shaded zones.
Long and short plans that size the position and show how the trade played out.
Market, limit and stop orders with brackets, break even, flatten and reverse.
Practise on live markets with real costs, without risking money.
Trade past sessions again from your own recorded tick data.
Alerts on levels and drawn lines, with sounds and spoken alerts.
Several charts in one window, linked crosshairs and shared drawings.
Watch many markets at once for the conditions you care about.
Eagle Charts is in development. Join the list and you will be among the first to trade with it.